> On-Premise Installations > Application Monitoring and Troubleshooting
Application Monitoring and Troubleshooting
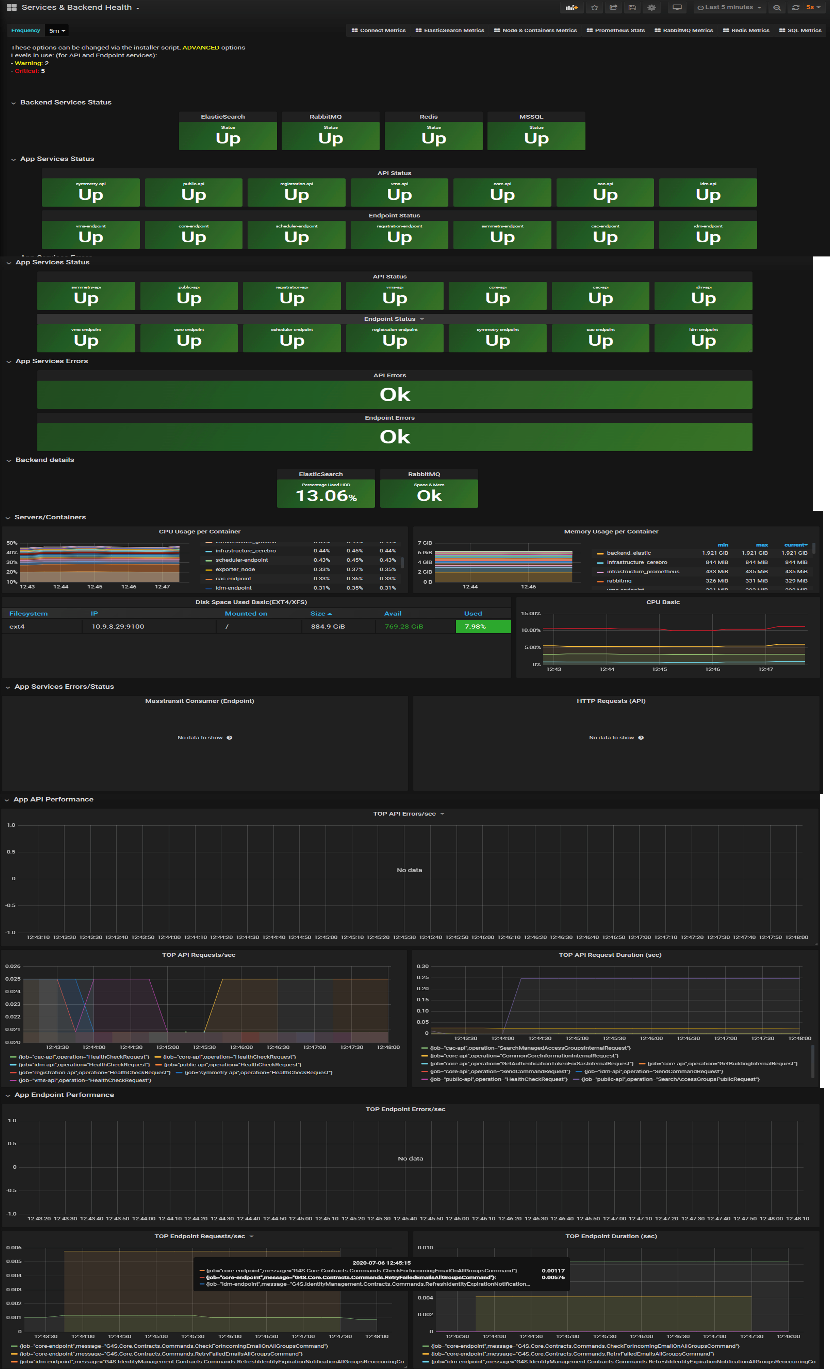
Monitoring
For monitoring purposes, a health dashboard is available via the following URL: https://:3000
The dashboard provides the following information:
-
Backed Services Status
- Returns Up if the service is available, other down.
- Includes:
- Elasticsearch
- RabbitMQ
- Redis
- Microsoft SQL Server
-
Services Status
- Returns Up if the service is available, other down
- The following services are monitored:
- CAC API
- CAC Endpoint
- Core API
- Core Endpoint
- IDM API
- IDM Endpoint
- Public API
- Registration API
- Registration Endpoint
- Scheduler Endpoint
- Symmetry API
- Symmetry Endpoint
- VMS API
- VMS Endpoint
-
App Services Errors
- Display the status of errors being returned by API and Endpoint
- Returns:
- Green
- Yellow
- Red
-
Backend Details
- Displays the percentage of hard drive space used by the Elasticsearch server
- Displays the availability of memory (RAM) and Hard drive space for RabbitMQ
-
Servers / Container
- CPU Usage by Docker Service and Server
- Memory Usage per Docker Container
Troubleshooting
The health dashboard is useful for determining if and where an issue can be as well as preventing possible issues such as disk space by providing a level of advanced notice. However, in the case that more information is needed the integrator/end user will need to be able to provide support with access to the following applications:
- Portainer – A web-based application used to view the status of the docker containers and services.
- RabbitMQ – A web-based management utility used to view the current state and messages in the queue
- Cerebra – A web-based management utility for Elasticsearch
- SQL Server Management Studio
- PuTTY – Used to access the Linux terminals of the host servers